
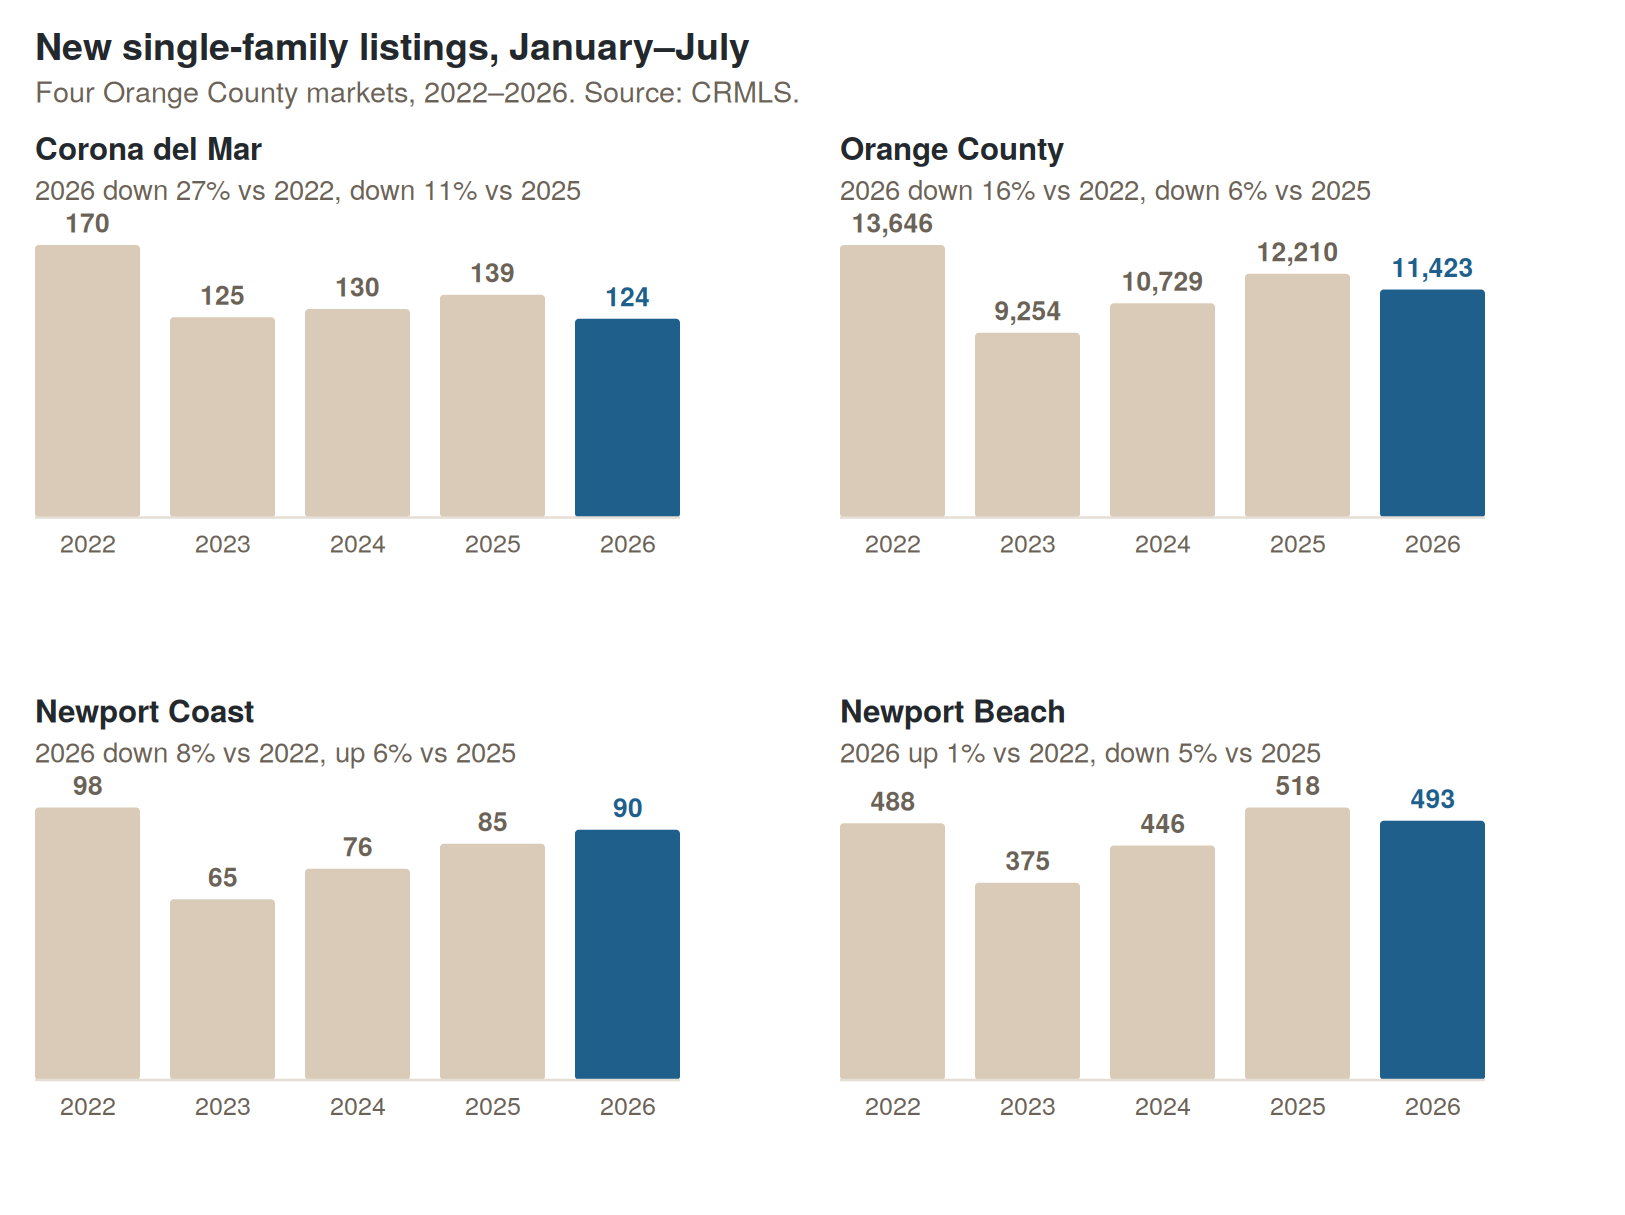
There is no single Newport Beach market. Pull the last five years of new single-family listings for four coastal markets and you get four different answers — one at a five-year low, one at a five-year high, and they are four minutes apart.
 Corona del Mar is the constrained one
124 new single-family listings through July. That is the lowest of any of the last five years — down 27% from 2022 and down 11% from last year. If you own a house in Corona del Mar, fewer neighbors are competing with you for buyers than at any point since the pandemic.
Adding duplexes doesn't soften it. Corona del Mar has a real two-unit market, and it is at its own five-year low — 6 new listings through July against 18 in 2024. Combined, houses and duplexes come to 130 new listings this year, versus 178 in 2022. The same 27% decline.
Standing inventory is the number that lands. Active duplex listings have averaged 1.4 per month this year. In 2024 that figure was 7.6. If you want a two-unit in Corona del Mar right now, there is close to nothing on the shelf. (Triplex and larger barely exists here — four listings in four and a half years.)
What makes it interesting is what it hasn't produced. Scarce supply usually means fast sales and strong appreciation. Corona del Mar is running about 71 days on market, and its home value index is up 4.3% year over year — the weakest of the four markets here.
Newport Coast went the other way
90 new single-family listings through July, up 6% from last year and the most since 2022. More sellers came to market here, not fewer.
And it absorbed them reasonably well: values up 9.5%, though days on market stretched from 63 to 83 and homes are averaging around 6% below list. That is a market with real supply and real demand, taking longer to clear.
Newport Beach proper is flat
493 new single-family listings through July, against 488 in 2022 — within one percent. Down about 5% from last year's 518, but comfortably above the 2023 trough of 375.
This is worth being precise about, because "new listings are back to 2022 levels" sounds alarming and isn't. 2022 front-loaded: its first seven months ran hot, then rates spiked and the back half collapsed to 172 listings. Matching that first half is matching an active market, not a drought. On a full-year basis 2022 finished at 660 against 769 last year.
The county is genuinely down
11,423 new single-family listings countywide through July — down 16% from 2022 and down 6% from last year. This is the one market where the four-year comparison shows a real decline.
MARKET | 2026 SFR (JAN–JUL) | VS. 2025 | VS. 2022 | FIVE-YEAR READ |
|---|---|---|---|---|
Corona del Mar | 124 | –11% | –27% | Five-year low (130 incl. duplex, also a low) |
Newport Coast | 90 | +6% | –8% | Highest since 2022 |
Newport Beach | 493 | –5% | +1% | Second highest |
Orange County | 11,423 | –6% | –16% | Below 2022, above 2023–24 |
Prices: two numbers, two directions
The same care applies to price. You have probably seen that Newport prices are falling. You have probably also seen that they are up nearly 10%. Both are real.
A median is the middle number of whatever happened to close. Change what closes and the median moves, even if no home changed value. It is a mix number. A value index tracks the same homes over time, so it controls for what is trading.
Median down while values are up is the signature of a mix shift — not of falling home values.
The obvious suspect is condos: more attached product trading would drag the median down. The MLS says no. Condos and townhomes have been a remarkably steady share of new Newport listings — 28% in 2022, 26% this year — and 2026 is the lowest condo share of the five years. If anything the mix tilted toward houses, which pushes a median up.
What is happening in attached product is separate and worth knowing on its own: new condo listings held flat while active condo inventory rose from an average of 52 in 2022 to 77 this year. Same flow in, slower absorption out. Newport's condo market is loosening even as its house market isn't.
Which points the median question somewhere else — at price tier within single-family. Fewer bayfront and estate closings and more mid-tier product would produce exactly this pattern, and it fits what the high end is doing: Newport Coast stretched from 63 days to 83, and homes above $4M are averaging several points under list. That is the likeliest explanation. It is not one I can prove from listing counts, and I would rather say so than dress up a guess.
Values by area
AREA | TYPICAL HOME VALUE | YEAR OVER YEAR |
|---|---|---|
Balboa Peninsula Point (92661) | $4,722,495 | +14.5% |
Newport Beach (citywide) | $3,687,121 | +9.8% |
Newport Coast | $5,626,772 | +9.5% |
Corona del Mar (92625) | $4,036,451 | +4.3% |
Every submarket is positive on a value basis. The spread is the story — the Peninsula Point at +14.5% and Corona del Mar at +4.3% are not the same market.
What sold, and how fast
AREA | MEDIAN SALE PRICE | MEDIAN YOY | DAYS ON MARKET |
|---|---|---|---|
Newport Beach (citywide) | ~$3.75M | –3% to –9.5% | 83–86 |
Newport Coast | ~$5.9M | +1.7% | 83 (up from 63) |
Corona del Mar | — | –8.1% | ~71 |
Balboa Island | ~$3.8M | –18% | 38 |
Balboa Island is the mix shift in miniature. Median down 18%, but 11 homes closed in June versus 6 last year and they moved in 38 days — the fastest in the city. More cottages trading, fewer bayfronts.
Newport Coast medians are unreliable on their own; volume is thin enough that one or two estate sales swing them hard. Published year-over-year figures for the same period range from +1.7% to +65% depending on the cut. The useful facts are the 6%-below-list average and roughly 90 days to pending.
The county backdrop
METRIC (JULY 2026, C.A.R.) | ORANGE COUNTY |
|---|---|
Median SFR price | $1,475,000 |
vs. June 2026 | –1.0% |
vs. July 2025 | +5.4% |
Sales vs. July 2025 | +0.6% |
Unsold Inventory Index | 3.1 months (up from 2.8) |
Median time to sell | 26 days |
Note the gap in days on market: 26 countywide against 71–86 on the Newport coast. That is the clearest single indicator that the high end is a different market from the county the headlines describe.
What this means
Put the two halves together. Single-family listing flow is roughly normal — down modestly countywide, flat in Newport, up on the Coast, genuinely thin only in Corona del Mar. Values are up everywhere. But days on market roughly doubled, from the 40s and 50s into the 80s, and sale-to-list slipped to about 95%.
Normal supply plus slower absorption means the slowdown is on the demand side. Buyers didn't disappear — they got patient and selective. That changes what a seller should do about it.
If you're selling
- The falling-median headline is not about your house. Your equity is very likely up year over year.
- What changed is time, not value. Assume 60–90 days, not 30, and plan carrying costs accordingly.
- Because the constraint is demand, not competition, condition and presentation matter more than they did in 2022. Patient buyers compare.
- Price to the last 90 days of comparable closings. A 2025 sale down the street is not a data point right now.
If you're buying
- Don't read the median as a discount. Values are up; what improved is your leverage on time and terms.
- Above $4M, closings are averaging several points under list. Ask.
- Corona del Mar has the fewest new listings in five years. If that is your target, less will come to market this fall than you might expect.
- Newport Coast has the most supply since 2022 — the best selection on the coast right now.
Sources and method. New listing counts: CRMLS, January–July, 2022–2026, pulled by market area. The four-market comparison above is single-family detached only; the condo and townhome figures in the price section, and the Corona del Mar duplex figures, are separate pulls of attached and small-income product. Counts include relists, which modestly inflates all years. Note that the median price and days-on-market figures come from third-party sources that combine attached and detached product, so they are not directly comparable to the CRMLS counts and should not be divided into each other. County figures: California Association of REALTORS®, July 2026 release. Home value figures: Zillow Home Value Index, most recent monthly readings (citywide as of the May release). Median sale prices and days on market: Redfin closing data, June 2026. List prices: Movoto, July 2026. Figures vary by source because they cover different geographies, time windows, and methods.